Using the CPX as a Data Acquisition System (DAQ)
Instrumentation is all about taking data......
Parts List
Laptop
CPX + USB Cable
Learning Objectives
Record real time measurements from the CircuitPlayground using the Serial monitor
Learn how to use the typing module to type data directly into a spreadsheet or text file
Learn how to log data on the on board memory of the CircuitPlayground
Extra Help
This is a pretty hard project to do with multiple different methods. After you’ve read through this document I suggest you watch a youtube I created on Logging Data with the Circuit Playground Express. I have also made video where I log temperature and accelerometer data using on board memory with the CircuitPlayground Bluefruit.
Text
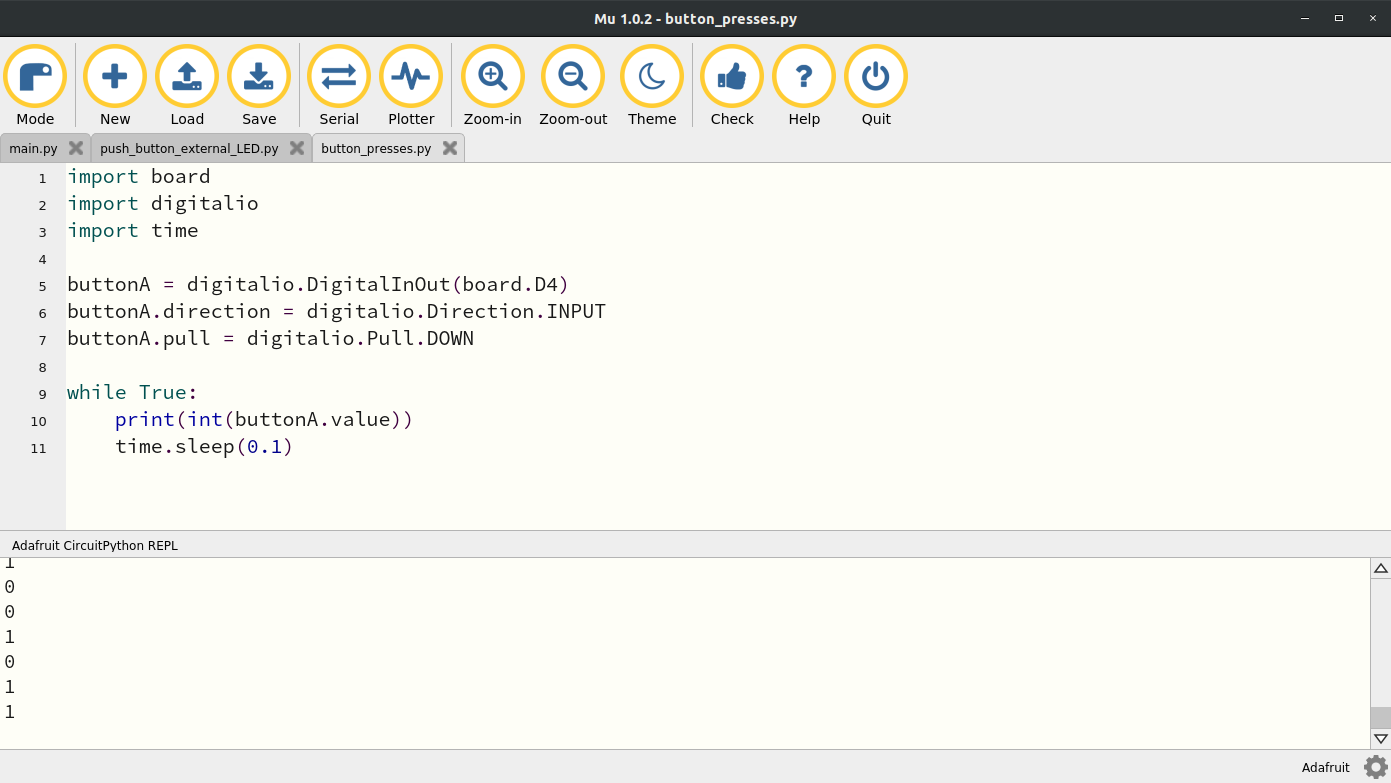
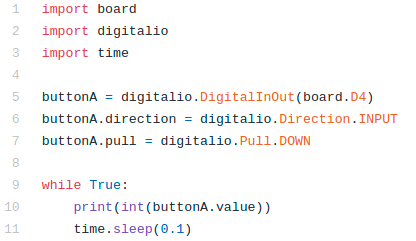
Taking data is the core of any instrumentation project. Data Acquisition Systems or DAQ for short come in all shapes and sizes. Believe it or not the CPX can be used as a crude and cheap DAQ. The CPX can easily take temperature data and monitor the temperature in a greenhouse or take humidity readings of a plant to monitor soil content. Before we learn about the different sensors on board the CPX, we want to make sure we can store that data later rather than just having it spit data out via the serial monitor. For starters though let’s get the CPX to print out something simple like button presses since we’ve touched on that already. The code I’m using is shown below and can also be found on Github.
The code is pretty similar to what I had in the past. I import board, digitalio, and time. I create a buttonA object using the digitalio library to record button presses. I then enter into a while loop print the buttonA.value. The difference here is that I use the int() function to convert the buttonA.value to an integer. The reason why I do this is because buttonA.value is a boolean. It is either True or False. An integer though is a number and thus a value of False is 0 and True is 1. If you open the serial monitor and push the A button down a few times you’ll see some zeros and 1’s.
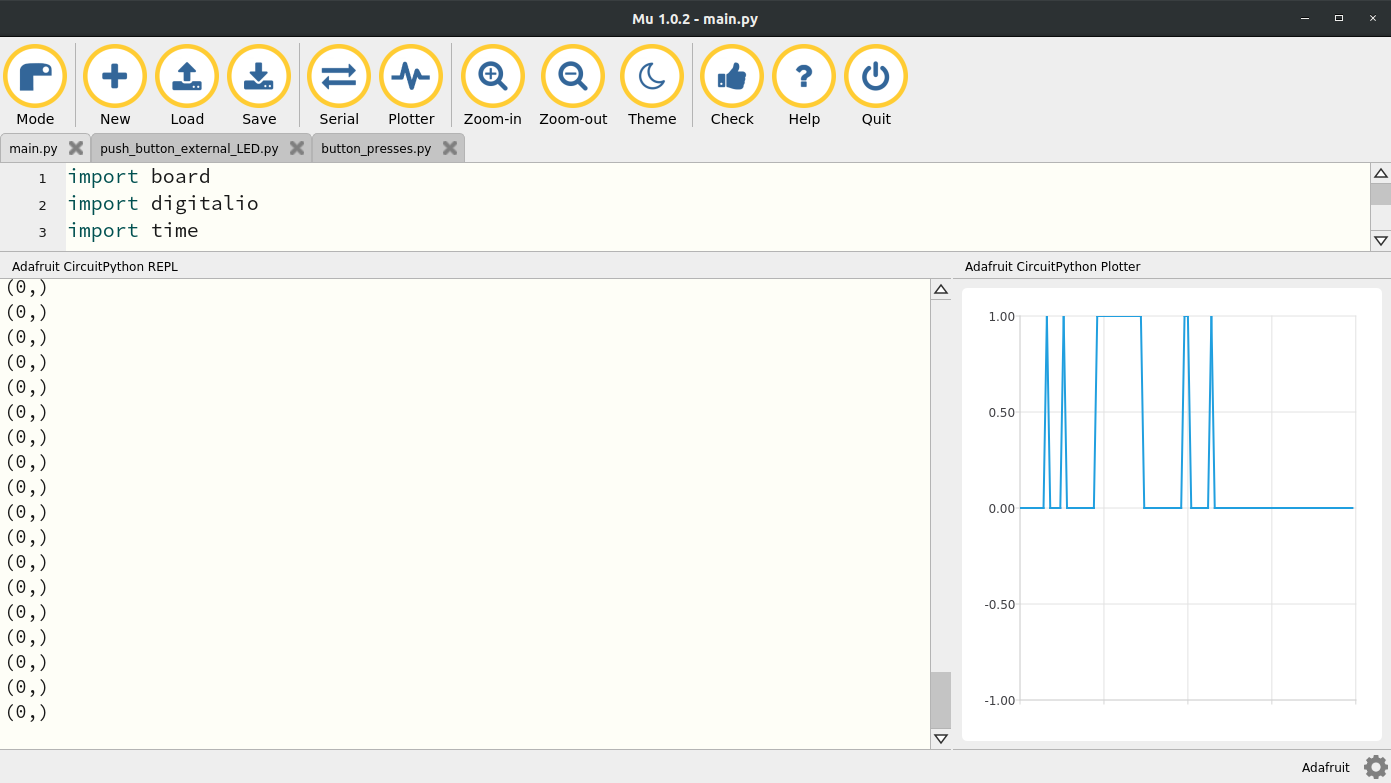
Mu also has a really neat builtin plotter. You’ll see next to the Serial button there is a button called Plotter. If you click that button now nothing will pop up on the screen. Unfortunately in order to plot using the Plotter you need to modify the print() statement to this:
print((int(buttonA.value),))
Notice the extra parentheses and the comma. Now if you click Plotter you’ll see something like this. You’ll notice that the print statement now has commas in it and the Plotter is recording button presses.
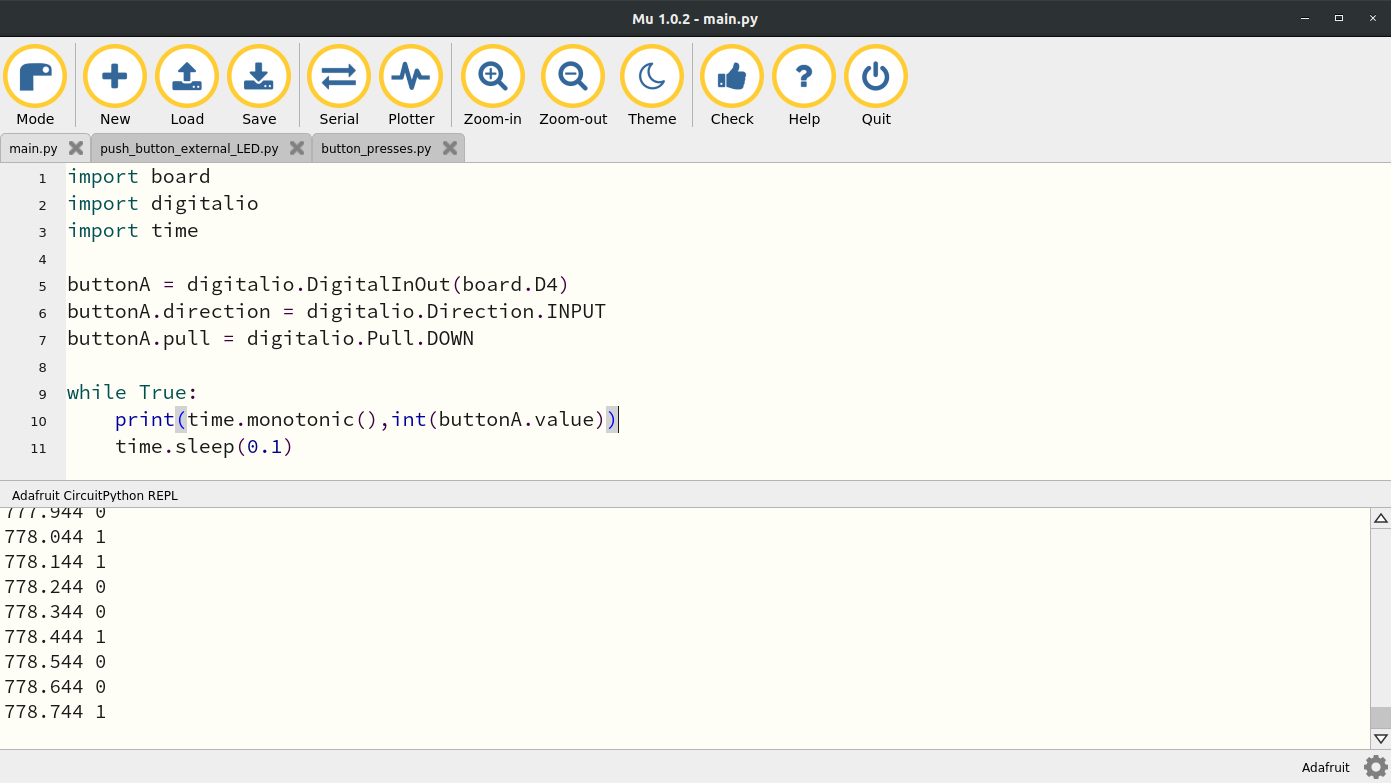
The problem with this is we still can’t save the recorded data anywhere. Before we get into saving data let’s first edit the print statement again to get rid of the Plotter by removing the extra parentheses and add time.monotonic() that way we can keep track of when a button was pressed. My print statement looks like this now:
print(time.monotonic(),int(buttonA.value))
Looking at the serial monitor now you’ll see that time is being printed alongside the button presses.
Now we are in a position where we can record some data and save it to our computer. There are 3 ways to record data.
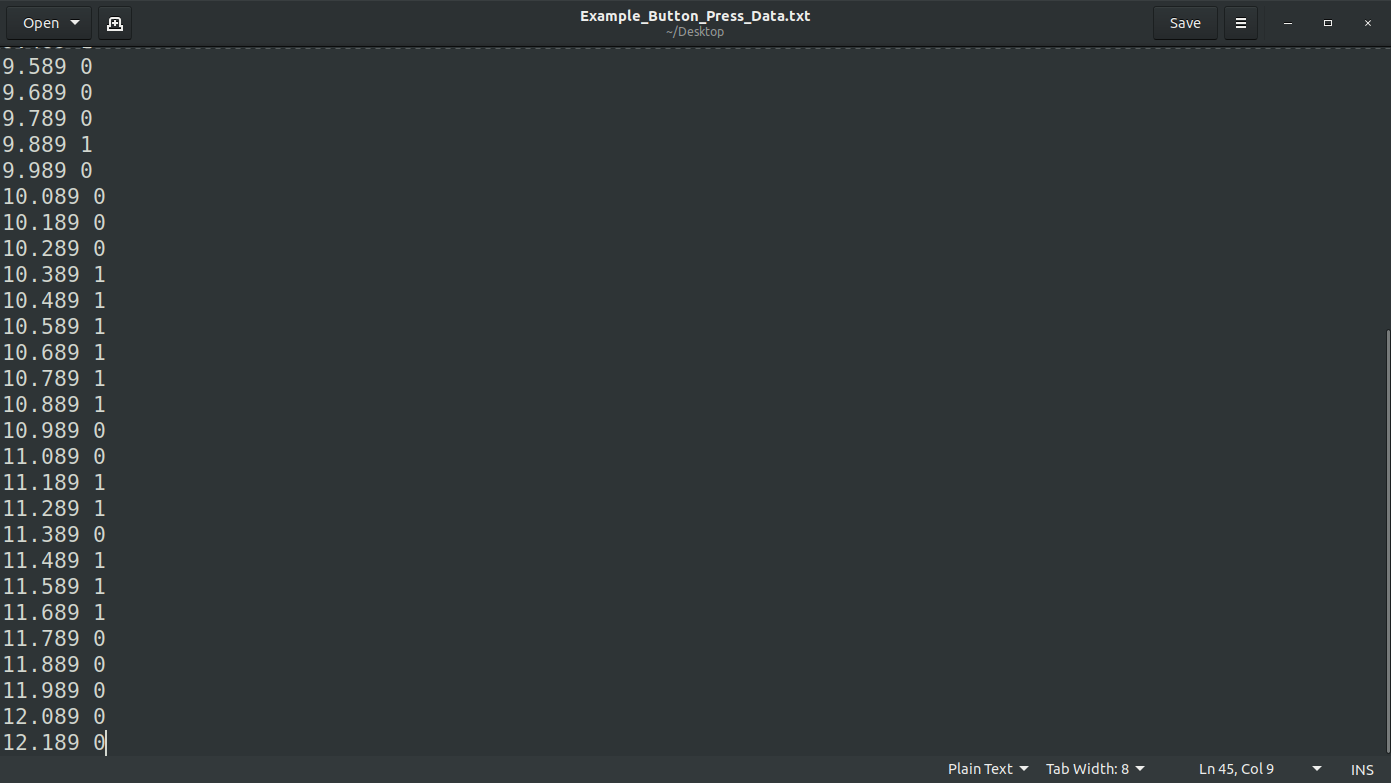
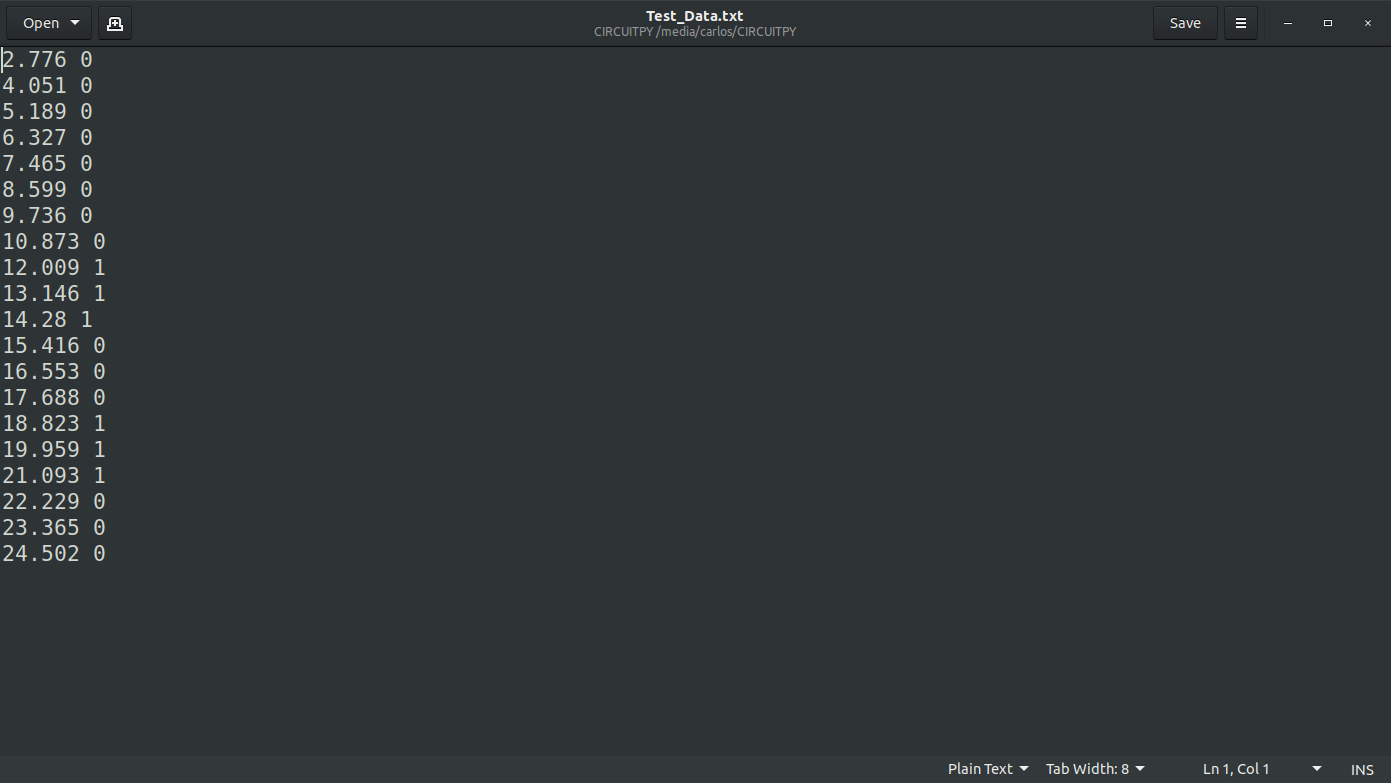
1. If you open up the serial monitor you can see the data output. If you unplug the CPX while it’s taking data the code will stop. Note: In newer versions, unplugging your CPX will result in a loss of data. If this happens try pressing CTRL+C after you click the REPL window. With the code stopped you can select all the data in the Serial monitor and then copy and paste the data into a text file on your computer. You can actually copy this into a new file on Thonny and just save it as a *.txt file. Once you have the data in a text file you can proceed to plotting in Python on your desktop which I discuss below. Here’s some example data in Gedit which is a simple text editing program.
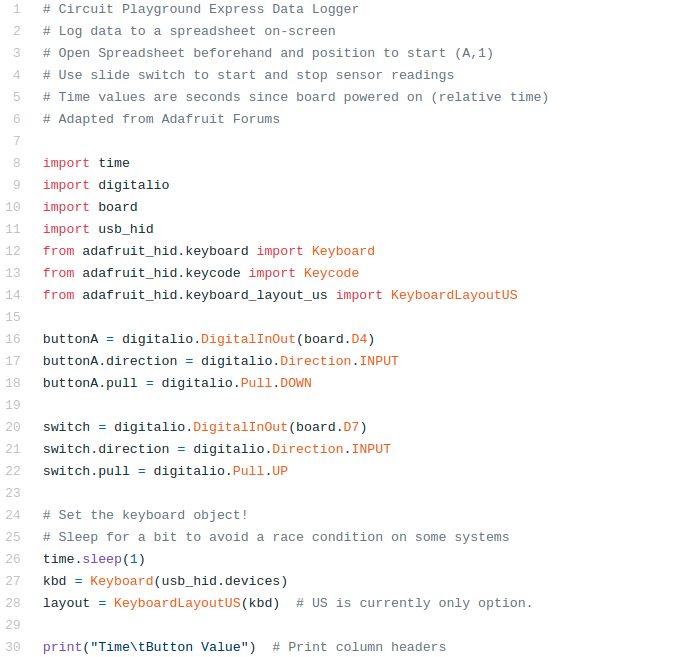
2. The downside with the above method of course is if you have a ton of data to record you could lose the data or run into a massive copy and paste issue. The second option is to use this module called keyboard which takes control of your keyboard on your desktop computer and actively types your data into a spreadsheet. The code is very extensive but I’ll include the simple one here so we can discuss it. Below are the first 30 lines of code. The first 6 lines of code are just comments since I heavily adopted this code from the Adafruit Forums. My version of this code can be found on my Github. Lines 8 - 14 are import commands as we’ve seen previously. The regular import modules board, time and digitalio are imported but we are also importing the Keyboard module so that the CPX can takeover our keyboard. Lines 16-22 create two buttons. First we create buttonA attached to pin D4 and then a switch attached to pin D7. If you look on the CPX there is a switch labeled D7. Before you copy this code onto the CPX make sure you move the switch towards the ear looking symbol. Lines 26-28 created the keyboard object. We are going to call it layout for this example code.
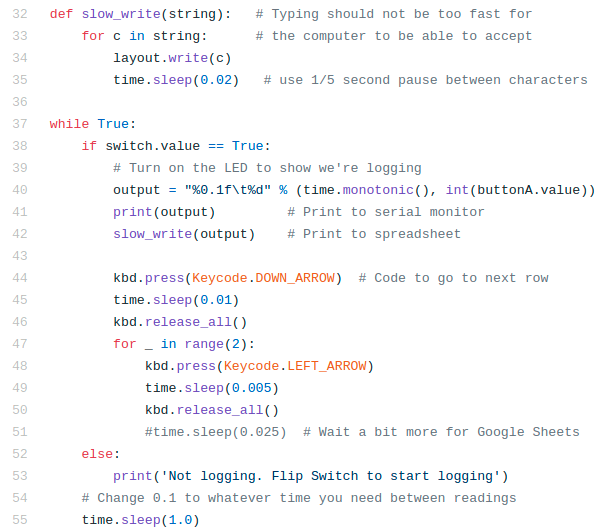
The next 30 lines are shown below. Lines 32-35 define a function. Functions in Python have a pretty standard structure. The keyword def is used to denote that the next line is a definition for a function. The name of the function is slow_write(). The input to the function is string which ironically enough is a string object. Line 33-35 define what the function does. Line 33 sets up a for loop where the code loops through each character in the string. Everytime it gets to a new character it will use your keyboard to type that character using the layout.write(c) command. The time.sleep(0.02) is just to slow down the keyboard so your computer can keep up. That function is defined above the standard while True: statement on line 37 but is called on line 42. You’ll see there is a slow_write(output) on line 42. In this case output is a string and it’s sent to the function slow_write(). So in this case we have a function that can write a string so we just need to take data and then write it using our keyboard. Line 38 is an if statement that will only be true if the switch on pin D7 is pushed towards the music note on the CPX. If the switch is not thrown the code will move to the else statement on line 52 and tell the user that you need to flip the switch. If the switch is thrown line 40 will take data for us. First it will record the time.monotonic() and store it as a floating point number using the %0.1f designation which means that it will store 1 decimal as a floating point number for f.
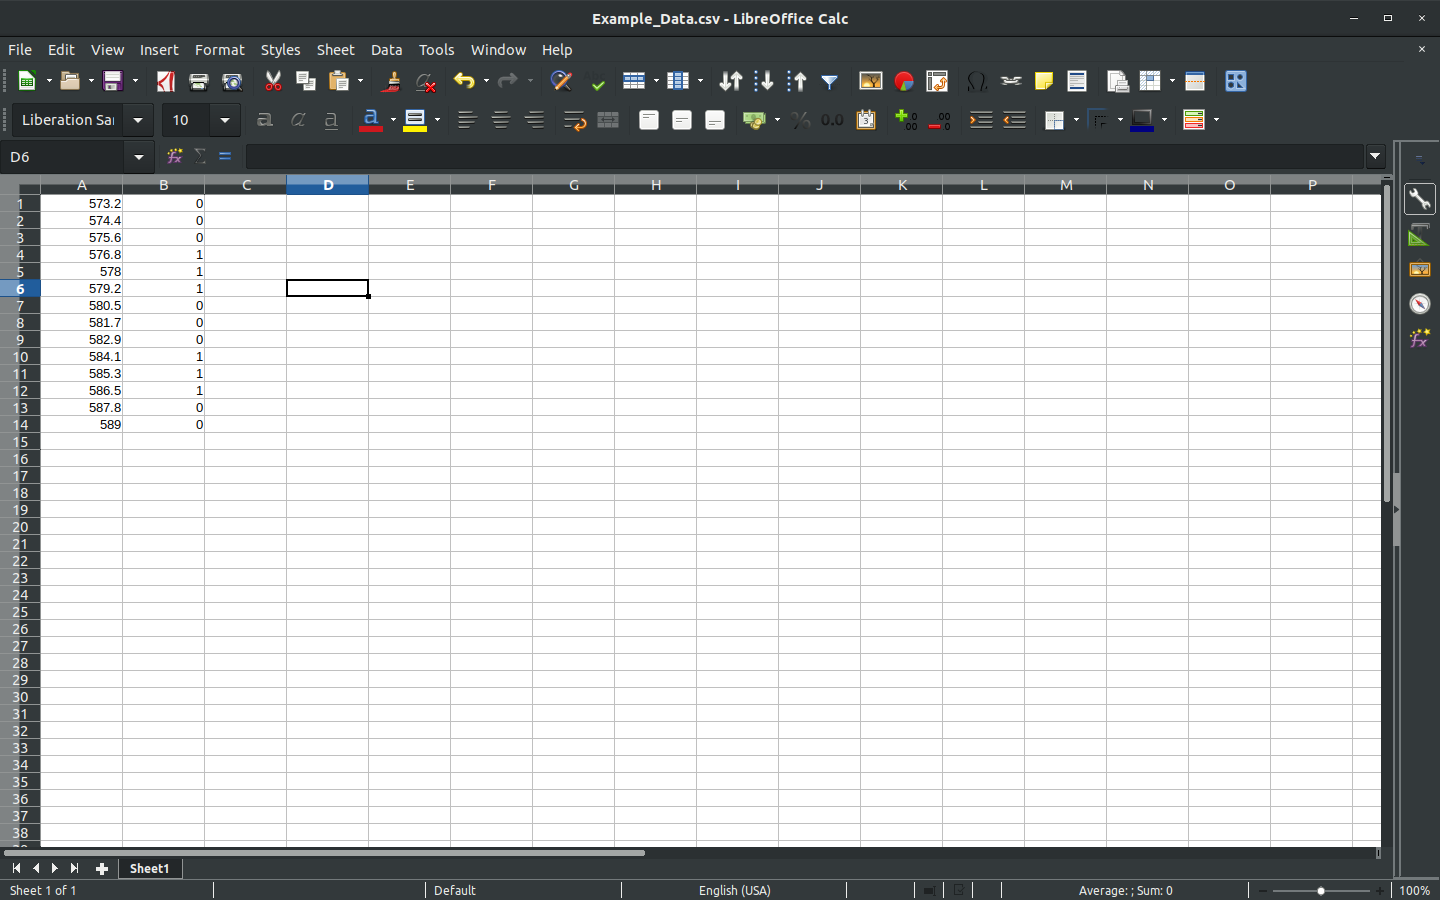
The second number in the string is an integer or a base 10 (decimal) integer designated by the %d part of the format. The integer is int(buttonA.value). You’ll see a \t in between the formatted numbers which is a tab. The tab is there to tab between cells in a spreadsheet. Line 41 will print the output string to the Serial monitor and it will also type the contents of the string. Very important here. When you flip the switch on the CPX your keyboard will start typing in whatever active window is selected. If you don’t have a spreadsheet opened and active (selected), the keyboard will just begin typing in whatever window is open. Make sure you have a spreadsheet program open and ready to go. Lines 44-51 tell the keyboard to hit the DOWN_ARROW on your keyboard to move to the next row and the LEFT_ARROW twice to move back to the first column. Line 55 is a sleep to only log data once a second. I ran this code for a bit and had it type into LibreOffice Calc which is a free spreadsheet program. Google Sheets or Microsoft Excel will also work just fine.
You’ll see that the first column is time with 1 decimal point and the second column is the button press values. At this point you must click Save As...and save the document as a CSV which stands for Comma Separated Value. Once you have the file saved you can proceed to plotting in Python on your Desktop.
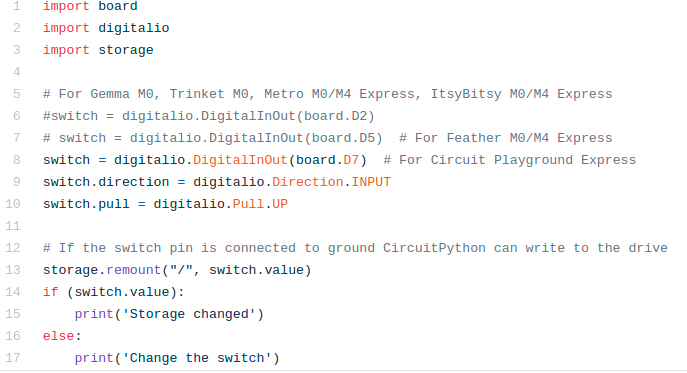
3. The problem with the above 2 methods is that you need a laptop to log data in the field. It would be nice if you could use the optional battery pack and just have the CPX log data on the CPX itself. This is the most complex way but in my opinion the best way. In order to get this to work you need to allow the drive on the CPX to have read/write permissions. This requires you to load a piece of software called boot.py and put it on the CPX. I have this software on my Github. The software is shown below. The first 10 lines are probably very familiar. Import some modules and then create a switch object. Line 13 is where all of the storage permissions are changed. If the flip is switched towards the A button, the storage module is used to allow you to write to the CPX. The problem here is that if you do this, you won’t be able to edit code. I’ll explain the procedure here in a minute. As always, the relevant Adafruit tutorial is on the Adafruit Learn System if you want to read more about it. Again make sure you store this file onto the CIRCUITPY drive and save it as boot.py
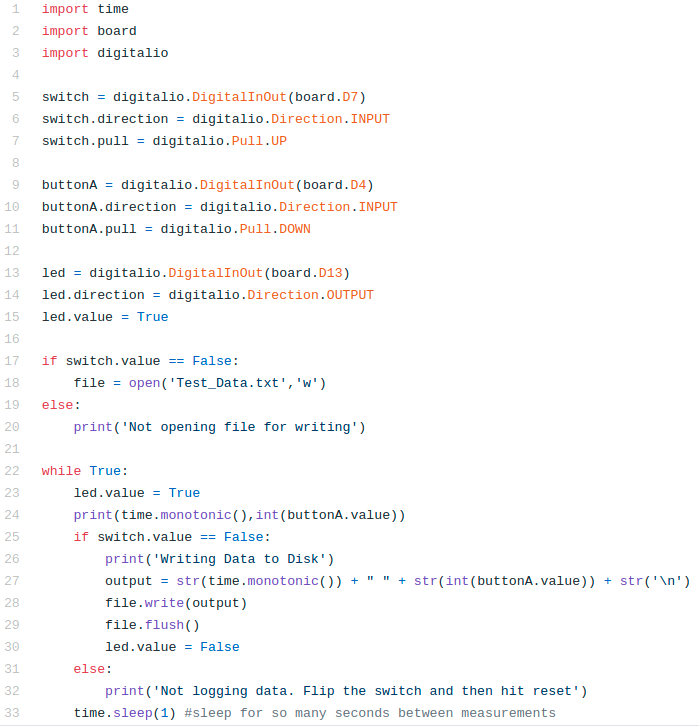
In addition to storing the file boot.py you’ll need to edit your main.py script to only log data when the switch is moved towards the B button. The software to record button presses on disk is shown below and as always on my Github. In this software we again see the standard commands. Lines 1-3 import all the modules we need and then 5-15 create a switch, a button and an LED. In this case we’re using the LED soldered to the board. Line 17-20 check to see if the user has flipped the switch. If the switch is False the storage module on boot.py will allow the drive to act like a data logger and it will open a file called Test_Data.txt for writing (‘w’). If the switch is True then the user will be notified that the file has not been opened for writing. Lines 22 through 33 include the infinite while loop. Line 23 turns the LED on and line 24 prints out the current time and the button value in integer form. If the switch value is False the program will create an output string by converting all numbers to strings using the str function. Notice that there is a str(‘\n’) at the end of the output variable which tells the computer to write a new line of data to the file. Lines 28 and 29 write the output to the file from line 18 and then flush the output which means the CPX waits for the data to be fully written before moving on. It also turns the LED off so we know the CPX took data even when we aren’t looking at the Serial monitor. If the switch value is true it means that the we never opened the data file and thus we tell the user we aren’t logging data and it’s time to flip the switch and hit reset.
So here is the flow of what you want to do for method 3.
Unplug the CPX
Flip the switch towards the A button.
Plug in the CPX and save the boot.py and main.py files. Remember you can only save Python scripts when the switch is flipped towards the A button.
When you are ready to start recording data, flip the switch towards the B button. If you’re looking at the Serial monitor, the software will throw an error. Just ignore it and hit the reset button. When your computer recognizes the CPX you can turn the Serial monitor on and off.
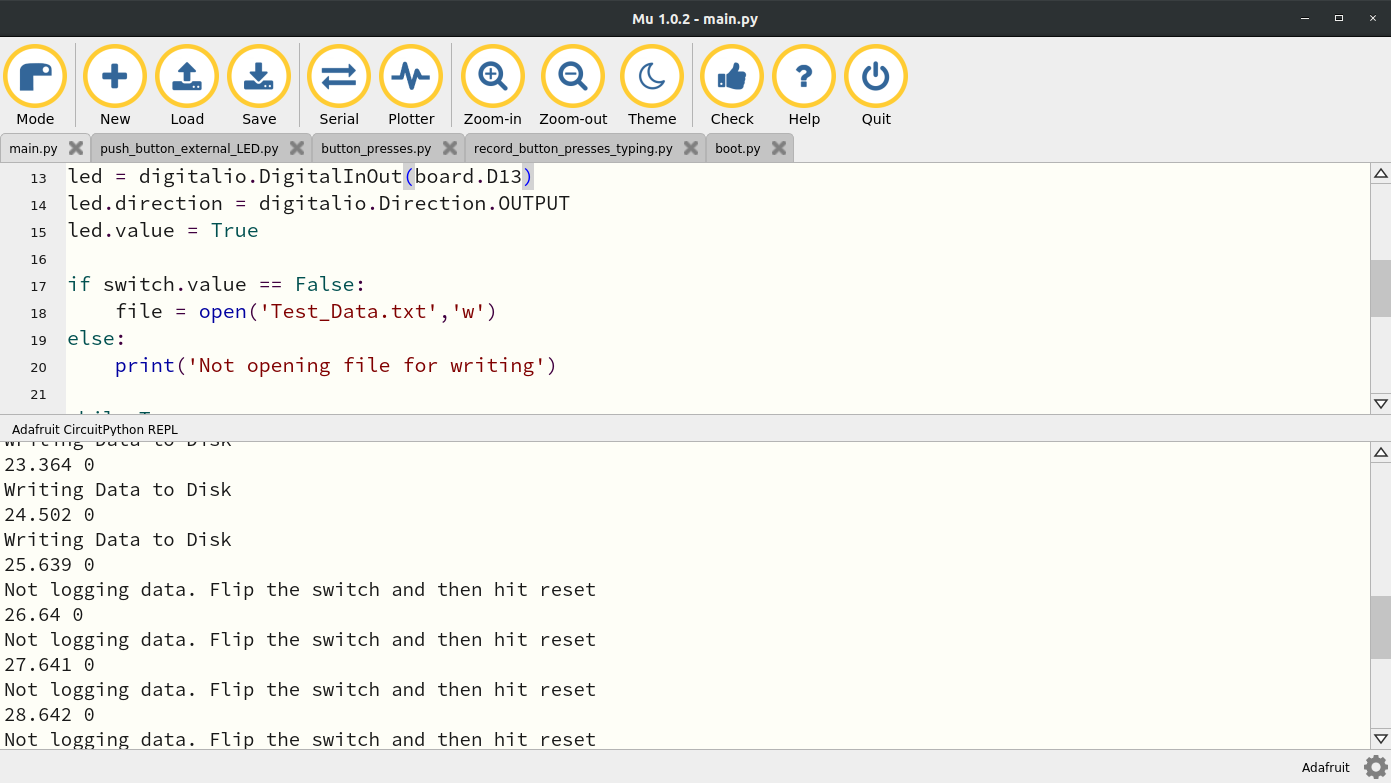
When you are done taking data simply slide the switch over towards the A button and hit reset again. This is what my Serial monitor looks like when I do this. You’ll see that I was writing to disk for like 25 seconds and then I flipped the switch back towards the A button.
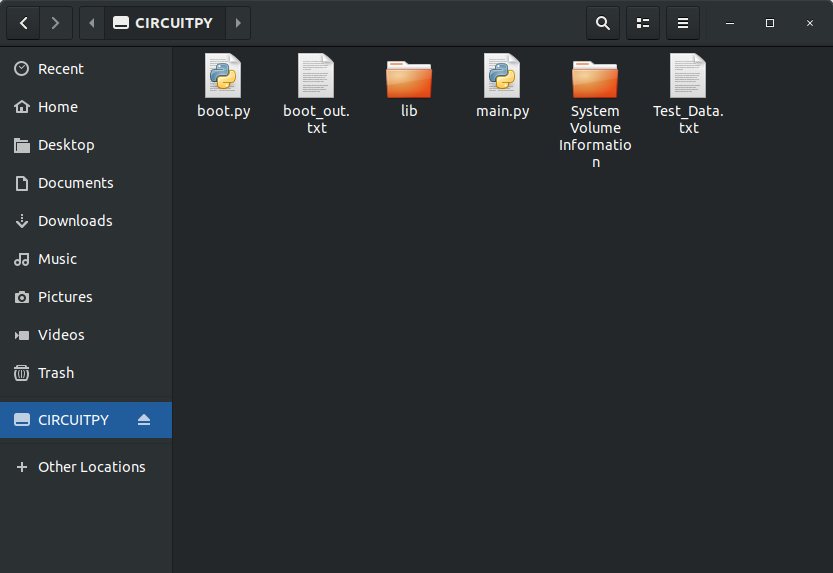
With the switch flipped and data taken, open your folder manager and take a look at the CIRCUITPY drive. This is what mine looks like. You’ll see I have two Python files and a file Test_Data.txt with all my data in it.
If you open the Test_Data.txt file you will hopefully see data in it.
At this point you can copy this text file over to your desktop computer and proceed to the Python plotting portion.
Ok so let’s recap method 3.
Unplug CPX (or remove power)
Slide switch to A
Plug in CPX (or provide battery power)
Slide switch to B
Reset
Take data for however long you want
Slide switch to A
Remove power if you’re on battery power
Plug CPX into computer if not already connected
Transfer data file to computer
Alright so there you have it. I have explained 3 methods to datalogging. Here are the methods again in summary.
Print data to Serial and copy and paste
Use the Keyboard module to save data to a spreadsheet
Access the storage of your CPX and write data to a text file on the CPX
All methods will work but some will obviously have their pros and cons. I suggest you get comfortable with 1 method and use that for the remainder of the semester. Whatever option you choose though will provide you with a data file that you can read in Python on your desktop computer to plot. The simplest way to import data is by using the loadtxt function from the module numpy. Here is some very simple code to plot data from a text file. I also have a Youtube video explaining how to plot a text file if you’d rather watch something.
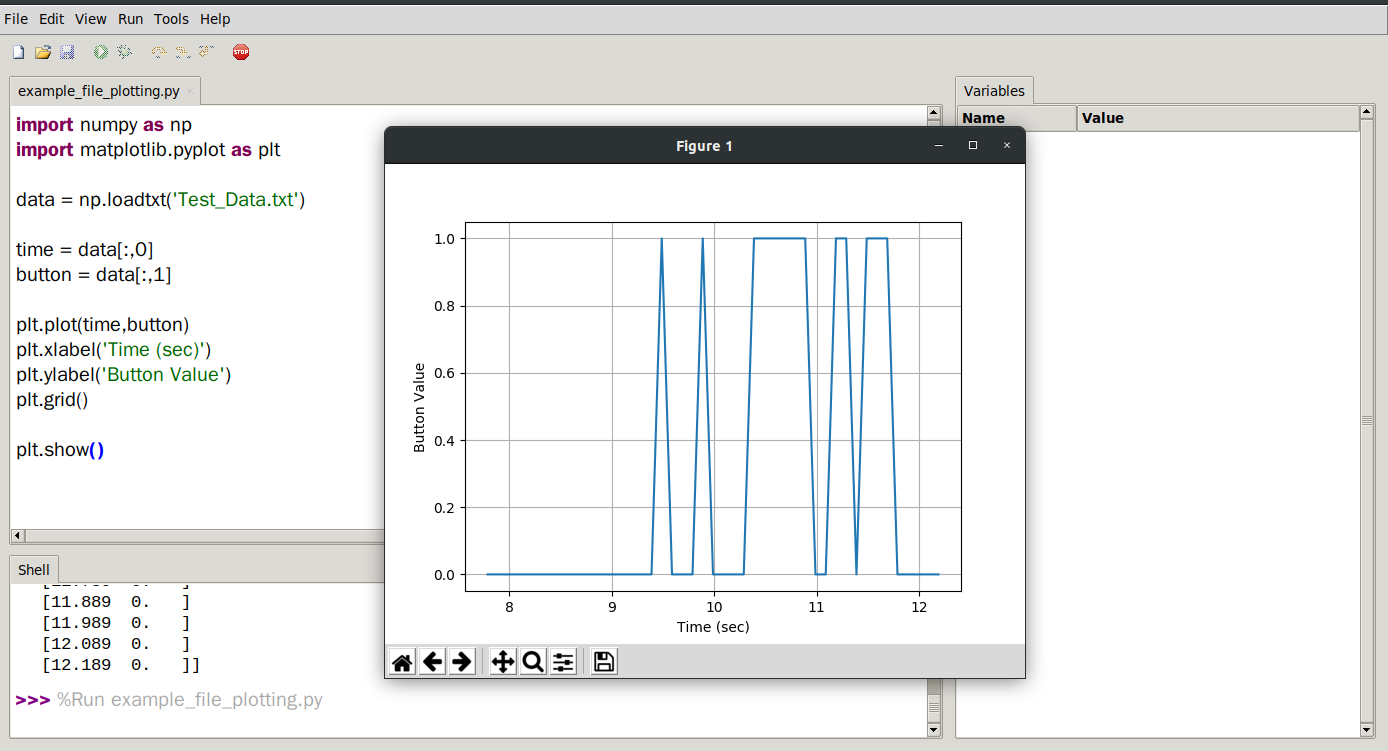
When you plot make sure your Test_Data.txt file is in the same folder as your plotting script in Thonny or Spyder. Here’s my example code (this code is not on Github but you only need 3 or 4 lines of code)
In this example lines 1 and 2 import numpy and matplotlib. Line 4 imports data from the Test_Data.txt file and then 6 and 7 save the first and second columns into time and button. The remaining lines plot the data and create x and y labels as well as a grid. Hopefully now you are well versed in taking data and plotting in Python.
Assignment
Upload a PDF with all of the photos and text below included. My recommendation is for you to create a Word document and insert all the photos and text into the document. Then export the Word document to a PDF. For videos I suggest uploading the videos to Google Drive, turn on link sharing and include a link in your PDF.
Use method 1, 2 or 3 and save time and button presses.
Include a video explaining which method you are using to record button presses and show yourself pressing the CPX button a few times and recording data. Make sure to wave and introduce yourself - 30%
Copy and Paste your CPX code used to log data - 20%
Copy and paste your Python desktop code used to plot your data - 20%
Include a plot of your button presses with time on the x-axis and button presses on the y-axis (no screenshots) - 30%
Last updated