Purchase Equipment and Download Python IDE for Desktop
Circuitpython -> CircuitPlayground and Python -> Desktop
Parts List
Laptop + internet connectivity
In this class you’re going to build some circuits that will enhance your learning experience. Rather than just solving problems by hand you’re going to take and analyze data. Over the summer of 2020, I began to work with Tangibles that Teach and they have graciously bundled all components together.
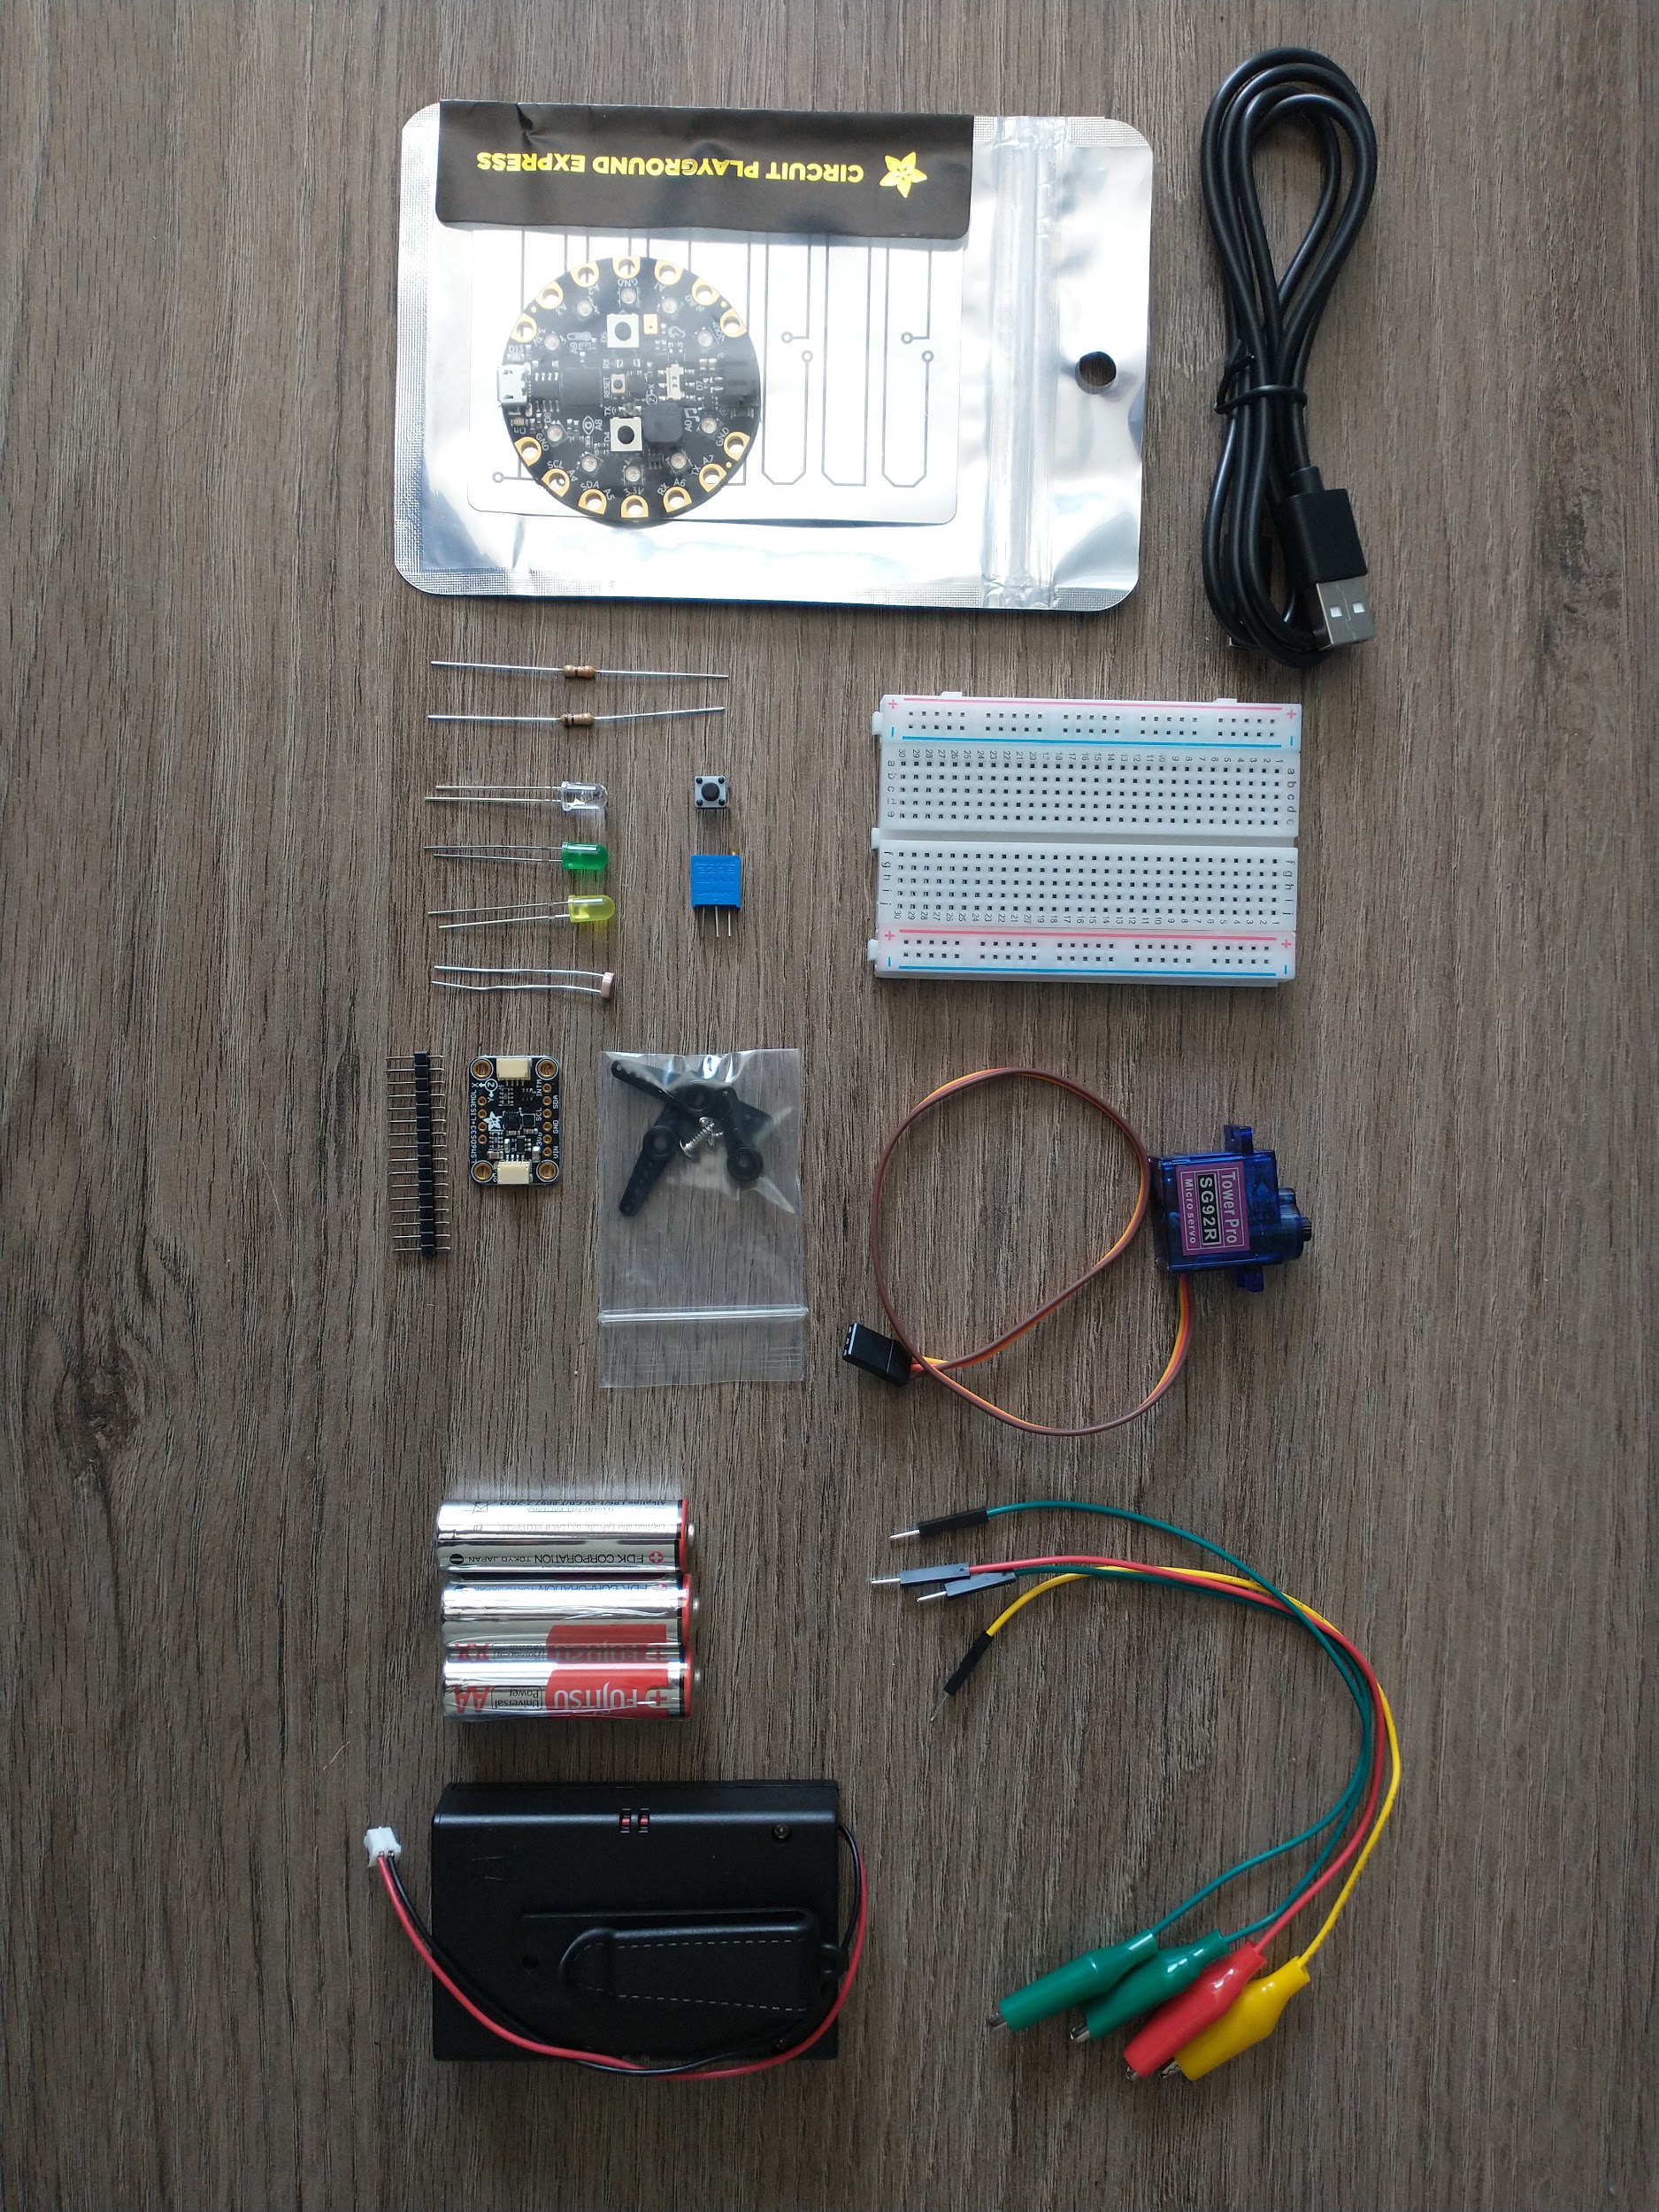
When you get your kit, familiarize yourself with all of the components!!!! I created an unboxing video on Youtube for you to take a look. Below is also a photo of all the components.
List of Items in Kit
The kit above comes with the following items. It is possible for you to purchase all items individually but it's possible you may end up getting the wrong component or paying more on shipping. Please exercise caution if you plan on purchasing everything individually.
Circuit Playground Bluefruit or Express + Included USB Cable
Micro Servo
Photocell
Two Resistors (330 Ohm and 1K Ohm)
Alligator Clips x3
External Battery Pack
AAA Batteries x3
Breadboard
Push Button
LEDs x2
LSM6DS33 + LIS3MDL - 9 DoF IMU
Part 1 Assignment
Purchase the required instrumentation kit and create a document with the following items.
A receipt of ALL of your purchases that shows you have purchased all items in the kit or just the kit itself from Tangibles that Teach - 50%
If you are working in pairs list who you are working with - 50%
PART 2 DOWNLOAD PYTHON FOR DESKTOP
As you learn Instrumentation throughout the semester, you will be tasked with creating computer programs on the Circuit Playground Express (CPX). The CPX itself has it’s own RAM, CPU, HDD and many sensors. Your CPX is kind of like a mini computer! You can plug the CPX into your computer via USB and access the hard drive (HDD) from your own computer. When you program on the CPX you need to write programs on the CPX itself so that the mini computer can run the program you wrote. The CPX knows how to read multiple different languages but in this class we are going to write everything in the Python language which has been ported to the CPX and called CircuitPython. Since we have to write everything in CircuitPython we need to first learn how to program some things in Python. You can easily download Python by itself but it’s nice to get what’s called an Integrated Development Environment (IDE). This way you can practice writing Python code on your computer while you wait for your purchases to arrive in the mail.
So which IDE can you download and which is recommended? I recommend two IDEs. They are listed below. I recommend getting either one. If you just Google “Python download” you will find a humongous list of editors (Scratch, Anaconda, Canopy, Eclipse, PyDev, etc). It’s easy to get lost when searching for something so broad. You’ve been warned.
It is possible to use Google Colab if you want to collaborate on Python projects or even get apps for your phone (Pydroid or Pythonista depending on Android or iPhone). You'll need to download 32 bit or 64 bit but which one? Well you need to figure out how many bits your computer has. This is a great thing to Google. Type the following: "do I have a 32 bit or 64 bit computer" into Google. I’m willing to bet you have a 64 bit computer but you may as well check. We’ll learn about the difference between 32 and 64 bit computers when we get to the projects on Binary.
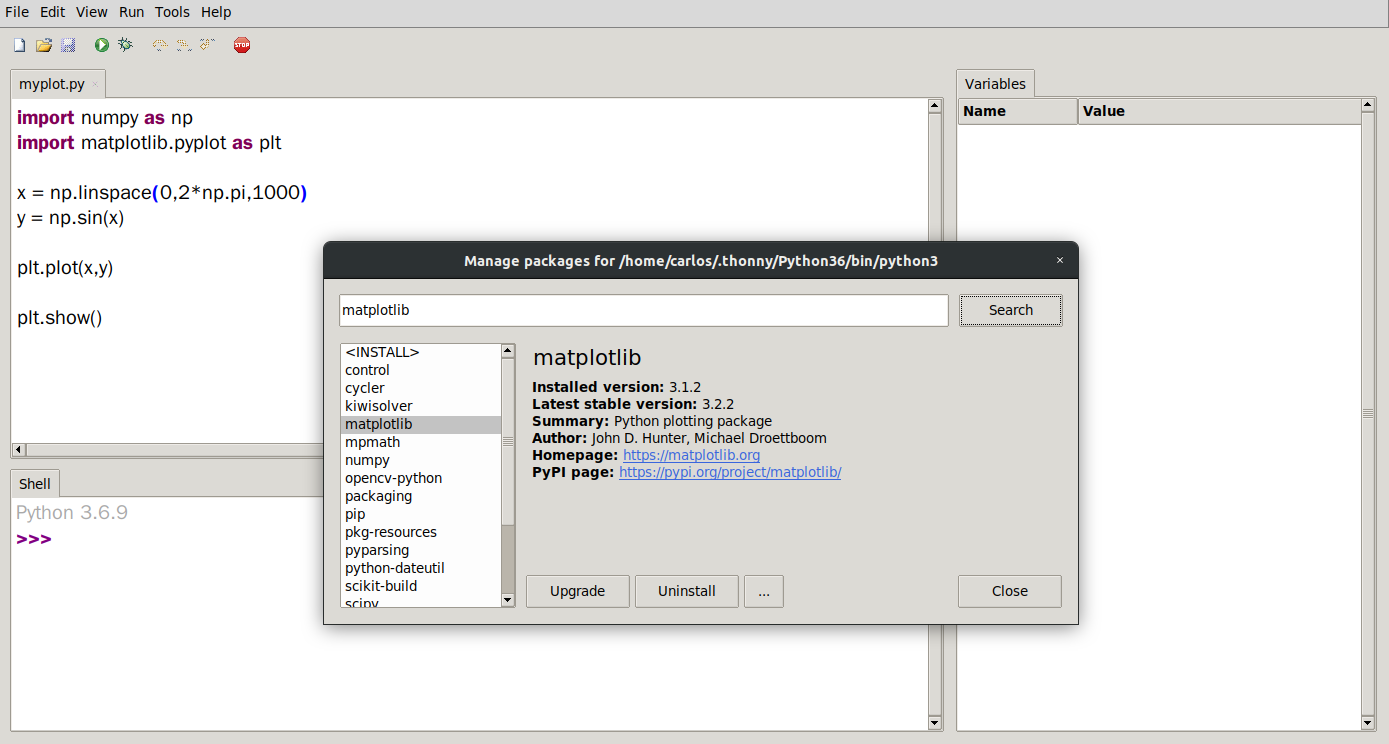
Once you have Thonny or Spyder installed you need to install numpy and matplotlib which are modules within Python that allow us to do some extra things like numerical computation with Python (numpy) and Matlab style Plotting libraries (matplotlib). I explain how to install modules in my Youtube videos above; however, you need to head over to Tools>Manage Packages in Thonny. You can see in the image below I already have version 3.1.2 but I can upgrade to 3.2.2
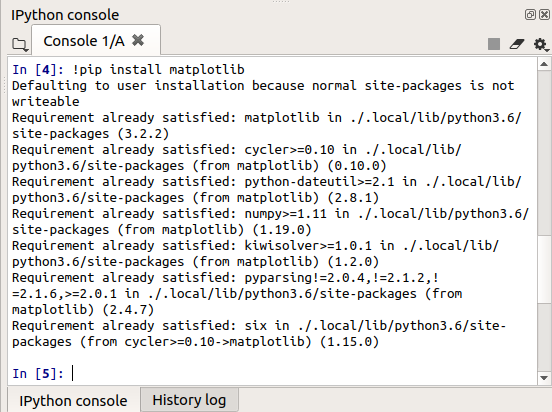
If numpy or matplotlib is not already included in Spyder then you need to type the following into the Python Console in the lower right hand corner of Spyder which is called the IPython console.
!pip install matplotlib
If that doesn’t work try
!pip3 install matplotlib
You can see in the output example below that I already have matplotlib installed as it says “requirement already satisfied”. Assuming you have a valid internet connection it will install the necessary module.
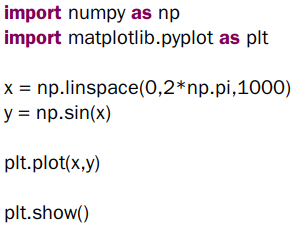
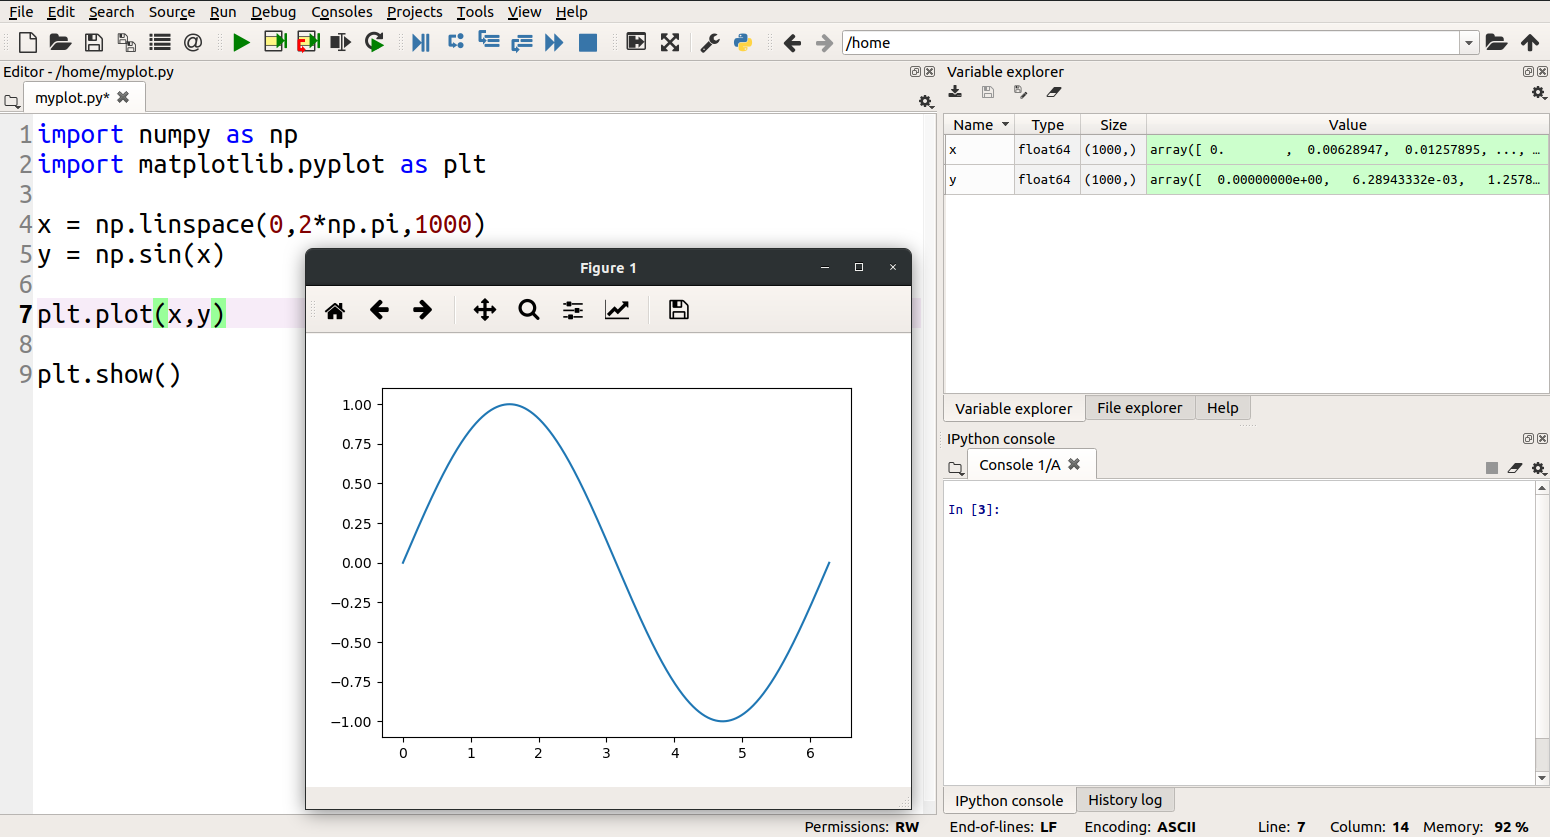
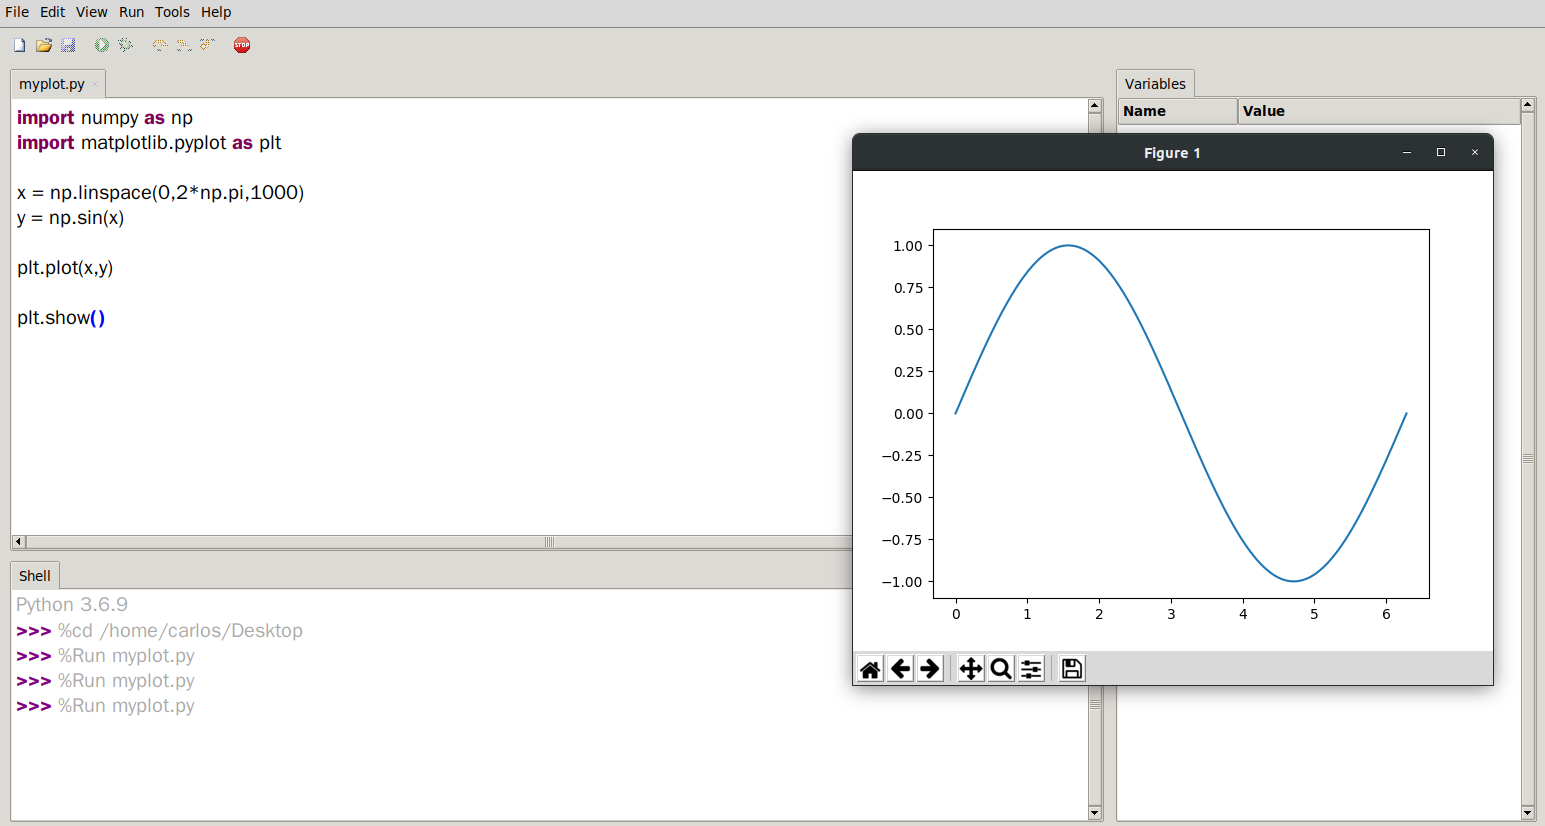
Once you have numpy and matplotlib it’s time to make a plot. I have a pretty comprehensive youtube video on how to plot in matplotlib but if you prefer text I will walk through a simple example.
The code above will plot a sine wave from 0 to 2pi. The two lines at the top are importing the numpy and matplotlib modules you installed earlier. When they are imported we give them shorter names so it’s easier to reference them so numpy will now be called np and matplotlib.pyplot will be called plt. The next two lines then create a vector “x” from 0 to 2pi using 1000 data points. The next line then uses the sine function to create the vector “y”. Finally “x” and “y” are plotted and the figure is instructed to pop up on your screen using the show() function.
Built-In Help Function and dir()
Running code will always create syntax errors. Typing your syntax error into Google will yield so many results you might get lost. Sometimes it helps to know how to learn things just from your computer. For example, type in the commands below in the IPython console or the Shell.
import numpy as np
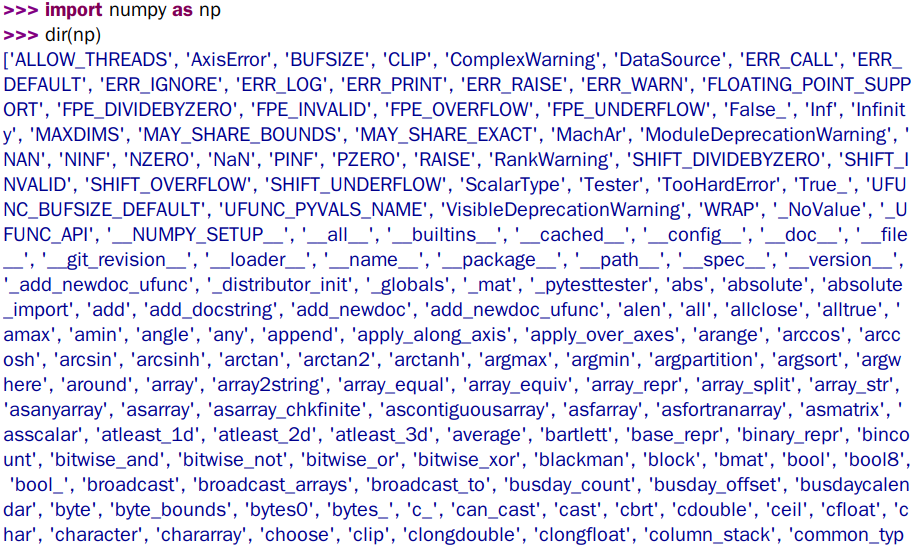
dir(np)
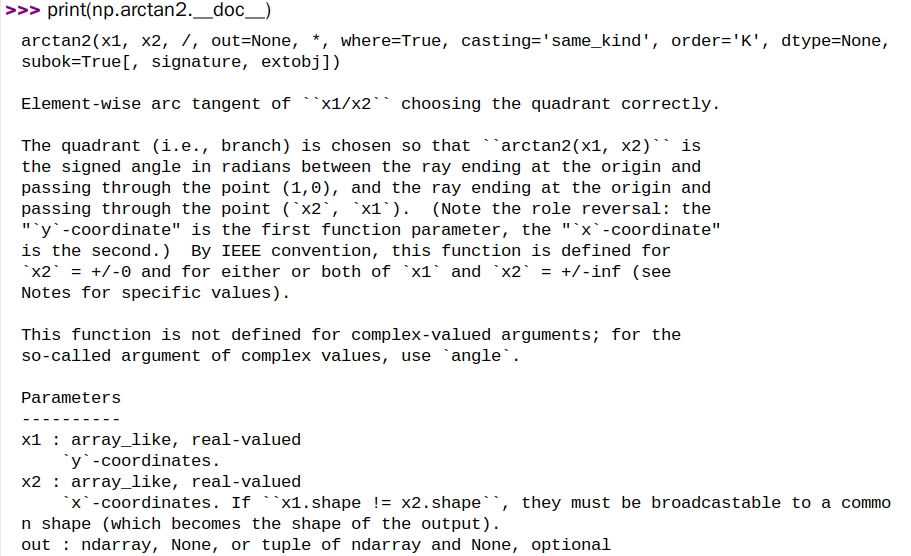
I included a photo of the output from the dir function. You’ll notice there are a ton of functions in numpy. Every function in Python has a __doc__ function. That’s two underscores followed by “doc” and then another two underscores. If you’re ever curious about what a particular function does you can just run the command below again in the IPython console or Shell. In this example I’m looking at what arctan2 does.
print(np.arctan2.__doc__)
You’ll see that arctan2 takes 2 input arguments “x1” and “x2”. I didn’t include the entire output but if you continue to scroll through the output it will even include examples on how to use the function.
Another way to learn certain functions is by visiting the appropriate documentation. This website for example has all the documentation you need for Numpy. Navigating that website you can find the same documentation for arctan2
As a last resort you can always Google “how to compute the inverse tangent 2 function in Python”. Note though that there is so much content out there on Google that you could easily get lost. Still, there’s also so much information that the answers are out there for just about anything.
So you have three methods for finding out how to program in python. The dir and __doc__ functions in Python, using the appropriate documentation online and of course Google. I’m lumping Youtube in with Google which is also another way to learn information although when I want to find information quickly I just use the documentation. It’s the best in my opinion.
Assignment Part 2
Plot the following function:
Plot the function from 0 to 10 seconds and label the x axis ‘Time (sec)’ and the y-axis ‘Temperature (F)’. Add a grid as well. You might need to look up how to do some of these things.
Upload a PDF with all of the photos and text below included. My recommendation is for you to create a Word document and insert all the photos and text into the document. Then export the Word document to a PDF.
Screenshot of your Python IDE running on your desktop computer - 25%
A selfie of you watching one of my Python Youtube videos - 25%
Copy and Paste your Temperature Plot Code even if it doesn't work - 25%
Use the SAVE function in matplotlib and insert a picture of your temperature plot. No screenshots! - 25%
Last updated